
Get & compare mortgage quotes anonymously Start in My Home
Verified Profile

Grand Bank for Savings

Bank•Hattiesburg, MS•Direct & Wholesale•Reviews near you on Google

Grand Bank for Savings has 109 closed loans in our dataset — fully analyzed and benchmarked against peers across the 5 Ps of Mortgage Shopping.

Safe Rate Ratings· each scored 1–5 against peer lenders
Pricing
Acceptable
2/5
vs. all lenders
Pull-through
Acceptable
2/5
closing strength
Product
Sound
3/5
FHA · Conventional
Place
Sound
3/5
Multi-Region · 3 mkts
Promptness
Not enough data
—/5
No quote responses measured yet

Safe Rate Summary

Things to Think About

  • Rates typically 107 basis points above market average
  • Pull through efficiency is below industry average

Explore another lender or local market

Verified Product Offerings

ConventionalFHAHELOCsITINUSDAVA

Languages Spoken

English

Report Card

Grand Bank for Savings performance at a glance

Overall Performance· Pricing & closing strength
Pricing
Rate competitiveness
Acceptable
+106.5 bps above market avg
2/5
Pull Through
Closing strength
Acceptable
Bottom 40% of lenders
2/5
By Loan Product· Specialization by type
Conventional
90 loans · 1.39% above market
Acceptable
Bottom 40% of lenders
2/5
FHA
16 loans · 0.67% above market
Sound
Top 60% of lenders
3/5
By Loan Purpose· Transaction purpose mix
Purchase
100 loans · 1.07% above market
Sound
Top 60% of lenders
3/5
By Location· Geographic coverage
Geographic Reach
Multi-Regional · 3 markets
Sound
Top 60% of lenders
3/5

Loan Product Performance

Performance by Loan Product

Conventional
Overall
Acceptable
Product
Acceptable
Pricing—
Pull Through
Acceptable
Volume90
Mix82.6%
Spread
+1.387%Above
Fees
$1,781Fees
FHA Loans
Overall
Sound
Product
Sound
Pricing—
Pull Through
Strong
Volume16
Mix14.7%
Spread
+0.667%Above
Fees
$1,851Fees

Loan Purpose Performance

Performance by Loan Purpose

Purchase
Overall
Sound
Product
Sound
Pricing
Acceptable
Pull Through
Sound
Volume100
Mix91.7%
Spread
+1.074%Above
Fees
$1,791Fees

At a Glance

Lender Overview

Lending Activity
Loans Originated
109
Applications
159
Volume
$23 million
Pricing & Closing
Avg Rate Spread
+1.065%
vs. market APOR
Avg Net Fees
$1,701
Origination − Credits
Pullthrough Rate
68.6%
Applications → Closed
Typical Borrower
Avg Loan Amount
$216,009
Avg Borrower Income
$93,284
Avg Property Value
$274,725

Geographic Coverage

Geographic Performance

Metro Areas
3
markets with activity
States Served
18
of 50 states + DC
Avg Place Specialization
Sound
3/5

States with Loan Originations

18Full-year 2024 · HMDA
18 states with loan originations
Loans originated
< 1010+None
Midwest6
ILINMNNEOHSD
South9
KYLAMSNCOKSCTNTXVA
West3
AZNVUT

Top Metro Areas by Place Specialization Score
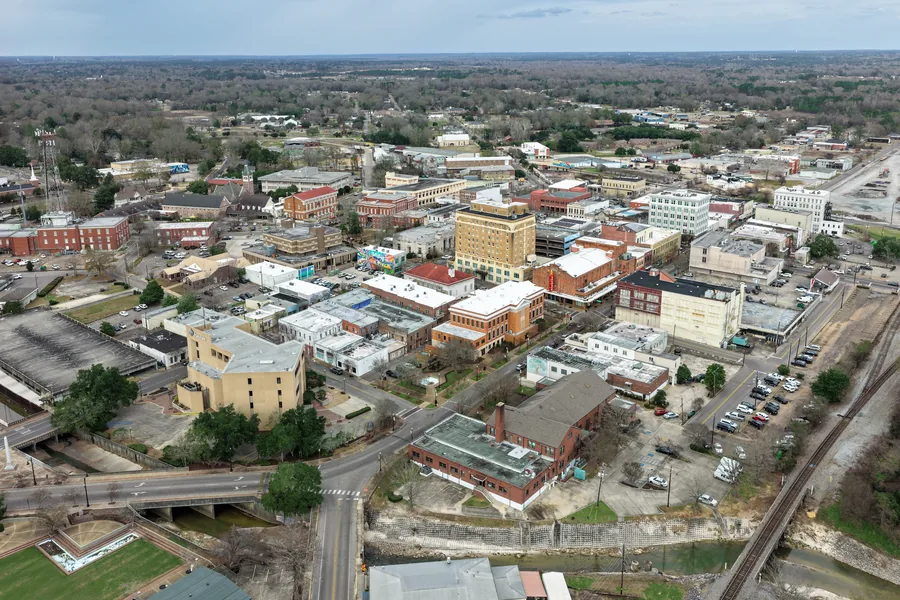
Volume 23Mix 21.10% of portfolio
66/100
Strong
2© TheWxResearcher · CC0
Indianapolis, INMetro
Volume 14Mix 12.84% of portfolio
49/100
Sound
Volume 11Mix 10.09% of portfolio
46/100
Sound

Top States by Place Specialization Score

Mississippi
Mississippi
1
MississippiState
Volume 28Mix 25.69% of portfolio
57/100
Sound
Nevada
Nevada
2
NevadaState
Volume 12Mix 11.01% of portfolio
47/100
Sound
Indiana
Indiana
3
IndianaState
Volume 14Mix 12.84% of portfolio
46/100
Sound
Texas
Texas
4
TexasState
Volume 13Mix 11.93% of portfolio
41/100
Sound

How We Rank Lenders

Our rankings use an equal-weight average of scores across the 5 Ps — Pricing, Product, Pull-Through, and Place — with lender promptness blending in as the fifth once a lender has responded to real shopper quote requests.

Our Point System (Max 50 Points)

10/ 50 pts
Pricing
How competitively a lender prices vs. the market benchmark (20%).
10/ 50 pts
Product
Performance on your specific loan type (20%).
10/ 50 pts
Pull Through
How reliably a lender closes the loans it starts (20%).
10/ 50 pts
Place
Depth of a lender's expertise in your local market (20%).
10/ 50 pts
Promptness
How quickly a lender answers real quote requests — blended in once they respond (20%).
Champion
Champion(80%+ = 40-50 points)
Superstar
Superstar(60-79% = 30-39 points)

Data Integrity & Updates

Data is updated quarterly based on the latest HMDA filings and proprietary SafeRate analysis. All metrics are calculated using standardized methodologies to ensure fair comparison across lenders.

Looking for a different lender?

The 5 PsRankings are calculated from observed lender differences on closed loans across Pricing, Pull-through, Product, and Place, plus Promptness when a lender has answered real shopper quote requests.
No Pay to PlayLenders cannot buy their way to the top. Rankings are 100% earned.
HMDA 2024Built using publicly available originated loan data from the federal government.
Peer BenchmarkedPerformance is normalized and benchmarked against peer institutions.