Get & compare mortgage quotes anonymously Start in My Home

Own Potlatch No. 1 Financial Credit Union? Claim this free profile to add your logo, loan officers and reviews.

Claim this Profile
PN1F

Potlatch No. 1 Financial Credit Union

Credit Union•Lewiston, IDHQ•Direct•Reviews near you on Google

Potlatch No. 1 Financial Credit Union has 183 closed loans in our dataset — fully analyzed and benchmarked against peers across the 5 Ps of Mortgage Shopping.

Safe Rate Ratings· each scored 1–5 against peer lenders
Pricing
Sound
3/5
vs. all lenders
Pull-through
Sound
3/5
closing strength
Product
Strong
4/5
Conventional
Place
Strong
4/5
Regional · 2 mkts
Promptness
Not enough data
—/5
No quote responses measured yet
Safe Rate Awards
Conventional Superstar
Conventional
Superstar
Refinance Superstar
Refinance
Superstar

Explore another lender or local market

Report Card

Potlatch No. 1 Financial Credit Union performance at a glance

Overall Performance· Pricing & closing strength
Pricing
Rate competitiveness
Sound
Rates 5.0 bps below market avg
3/5
Pull Through
Closing strength
Sound
Top 60% of lenders
3/5
By Loan Product· Specialization by type
Conventional
174 loans · 0.06% below market
Strong
Top 40% of lenders
4/5
By Loan Purpose· Transaction purpose mix
Purchase
132 loans · 0.15% below market
Sound
Top 60% of lenders
3/5
Refinance
51 loans · 0.16% above market
Strong
Top 40% of lenders
4/5
By Location· Geographic coverage
Geographic Reach
Regional · 3 markets
Strong
Top 40% of lenders
4/5

Loan Product Performance

Performance by Loan Product

Conventional
Overall
Strong
Product
Strong
Pricing
Strong
Pull Through
Strong
Volume174
Mix95.1%
Spread
-0.056%Below
Fees
$2,423Fees

Loan Purpose Performance

Performance by Loan Purpose

Purchase
Overall
Sound
Product
Sound
Pricing
Sound
Pull Through
Sound
Volume132
Mix72.1%
Spread
-0.154%Below
Fees
$2,809Fees
Refinance
Overall
Strong
Product
Strong
Pricing
Strong
Pull Through
Strong
Volume51
Mix27.9%
Spread
+0.160%Above
Fees
$2,142Fees

At a Glance

Lender Overview

Lending Activity
Loans Originated
183
Applications
298
Volume
$56 million
Pricing & Closing
Avg Rate Spread
-0.050%
vs. market APOR
Avg Net Fees
$2,588
Origination − Credits
Pullthrough Rate
61.4%
Applications → Closed
Typical Borrower
Avg Loan Amount
$311,339
Avg Borrower Income
$122,907
Avg Property Value
$527,350

Geographic Coverage

Geographic Performance
Metro Areas
2
markets with activity
States Served
3
of 50 states + DC
Avg Place Specialization
Strong
4/5

States with Loan Originations

3Full-year 2024 · HMDA
3 states with loan originations
Loans originated
< 100100+None
West3
IDORWA

Top Metro Areas by Place Specialization Score

1© Quintin Soloviev · CC BY 4.0
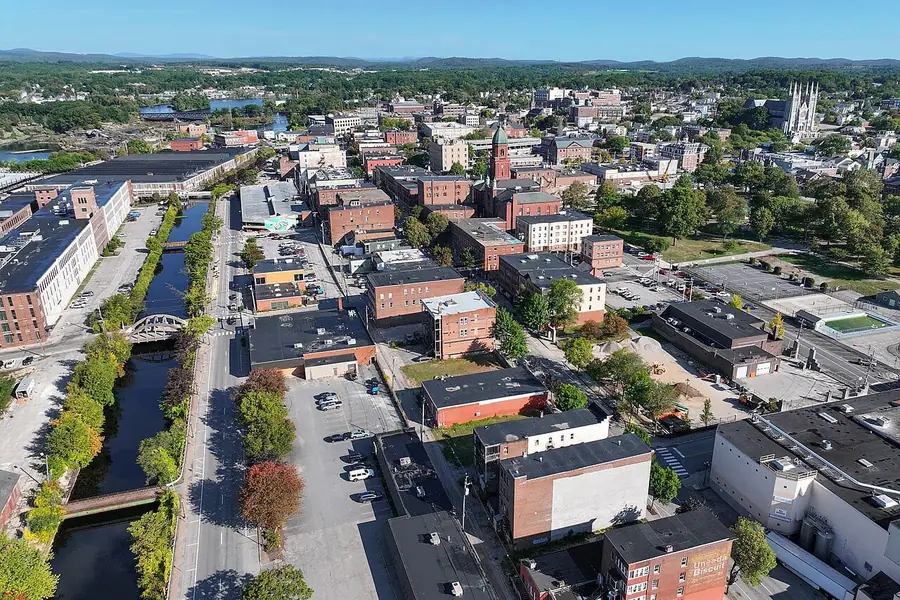
Lewiston, ID, ID-WAMetro
Volume 59Mix 32.24% of portfolio
97/100
Exceptional
2© pasa47 · CC BY 2.0
Coeur d'Alene, IDMetro
Volume 11Mix 6.01% of portfolio
48/100
Sound

Top States by Place Specialization Score

Idaho
Idaho
1
IdahoState
Volume 109Mix 59.56% of portfolio
70/100
Strong
Washington
Washington
2
WashingtonState
Volume 70Mix 38.25% of portfolio
66/100
Strong

How We Rank Lenders

Our rankings use an equal-weight average of scores across the 5 Ps: Pricing, Product, Pull-Through, Place, and Promptness. Promptness measures how quickly a lender answers real shopper quote requests; a lender with none measured yet is counted at an estimate.

Our Point System (Max 50 Points)

10/ 50 pts
Pricing
How competitively a lender prices vs. the market benchmark (20%).
10/ 50 pts
Product
Performance on your specific loan type (20%).
10/ 50 pts
Pull Through
How reliably a lender closes the loans it starts (20%).
10/ 50 pts
Place
Depth of a lender's expertise in your local market (20%).
10/ 50 pts
Promptness
How quickly a lender answers real quote requests — blended in once they respond (20%).
Champion
Champion(80%+ = 40-50 points)
Superstar
Superstar(60-79% = 30-39 points)

Data Integrity & Updates

Data is updated quarterly based on the latest HMDA filings and proprietary Safe Rate analysis. All metrics are calculated using standardized methodologies to ensure fair comparison across lenders.

Looking for a different lender?

The 5 PsRankings are calculated from observed lender differences on closed loans across Pricing, Pull-through, Product, and Place, plus Promptness when a lender has answered real shopper quote requests.
No Pay to PlayLenders cannot buy their way to the top. Rankings are 100% earned.
HMDA 2024Built using publicly available originated loan data from the federal government.
Peer BenchmarkedPerformance is normalized and benchmarked against peer institutions.